DS4A - Credit Card Fraud Detection
Written on December 19th, 2023 by Frank Hsiung
Analyzing Financial Transactions for Fraud Detection
The widespread impact of fraudulent transactions on the US economy is both alarming and profound. In 2023, financial fraud remains a significant concern, with an estimated 40 billion dollars lost annually to these deceptive practices. These losses not only affect individual victims but also destabilize financial institutions and erode consumer trust in the economy. The repercussions extend beyond mere financial loss, leading to increased regulatory scrutiny, higher costs for security measures, and a general sense of vulnerability among consumers and businesses alike.
This escalating issue underscores the critical need for robust fraud detection and prevention strategies. Motivated by this urgency, my project focuses on leveraging advanced data science techniques to analyze card, user, and transaction data. The goal is to unearth patterns and insights that could aid in the early detection of fraudulent activities, thereby safeguarding the economy and protecting individuals from financial harm.
In this project, I will dive deep into the world of fintech, exploring a dataset of card, user, and transaction data to detect potential fraudulent activities. Using various data science techniques, we aim to uncover insights that could help in preventing financial fraud.
<br > <br >
Setting Up the Environment
import pandas as pd
import numpy as np
import matplotlib.pyplot as plt
import seaborn as sns

import warnings
warnings.filterwarnings("ignore")
In the setup, essential libraries like Pandas, NumPy, Matplotlib, and Seaborn are imported. We also suppress warnings to keep the notebook clean.
<br > <br >
Data Loading
The data consists of detailed information about cards, users, and their transactions. The datasets are stored in compressed files, which I first need to extract.
!unzip /content/Card_User_Transaction.zip -d /content/
After unzipping, I have access to files: Card.parquet, Transaction.parquet, and User.parquet.
<br > <br >
Data Preprocessing
Basics
In a lot of data science projects, it’s common that we apply some of the following preprocessing approaches to make our data leaner, more machine-friendly, and more informative: 1) Drop null rows when it’s not taking too much of the dataset 2) Merge relational data sheets 3) Feature mapping: categorical feature to numerical feature. This project is also not an exception.
Zip code to distance
One of the more interesting preprocessing method that I apply is dealing with zipcode column. In the page of a research paper Transaction aggregation as a strategy for credit card fraud detection from Carnegie Mellon University, it says that The occurrence of two transactions in geographically distant locations at nearly the same time. I therefore take distance between transaction and card registration into consideration when I am doing the analysis.
Here, I use uszipcode, and GeoPy to turn zip code into latitude/longitude and then use them to calculate the distance of transaction location and card registration location.
from geopy.distance import geodesic
df['Transaction_dis_User'] = df.apply(lambda x: geodesic((x['Tran_Latitude'], x['Tran_Longitude']), (x['User_Latitude'], x['User_Longitude'])).kilometers, axis=1)
<br > <br >
Exploratory Data Analysis (EDA)
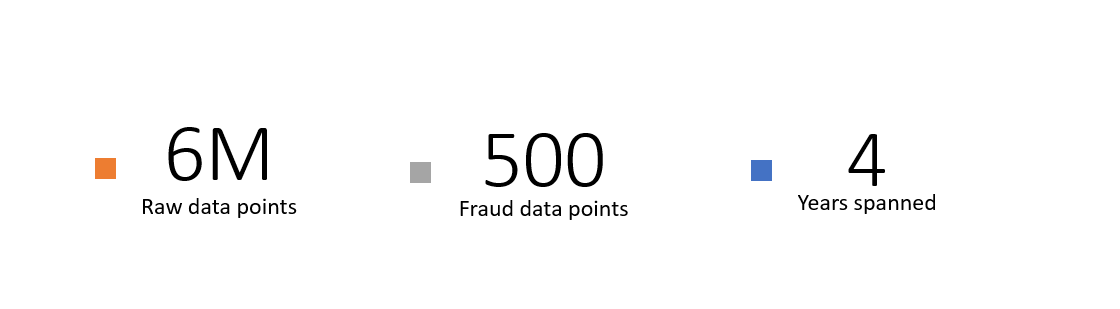
From the following macro statistics, we observe an obvious imbalance between fraud and non-fraud transaction, which potential cause the difficulty of training a smart machine learning model out of it.
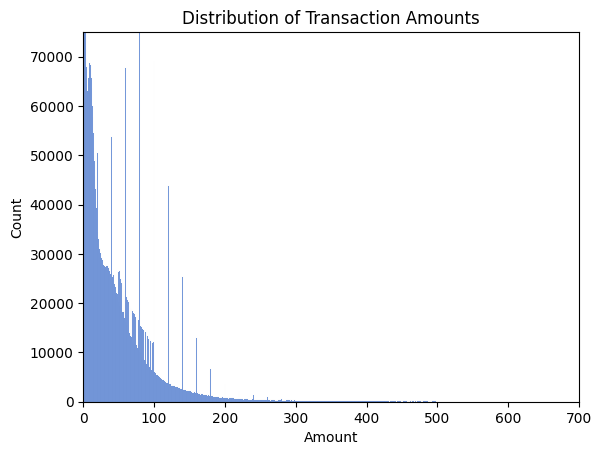
The distribution of amount of transaction is strongly right-skewed, which provide us with a hint of either finding a clear outlier pattern or a decision driving factor of the underlying rule of fraud transaction.
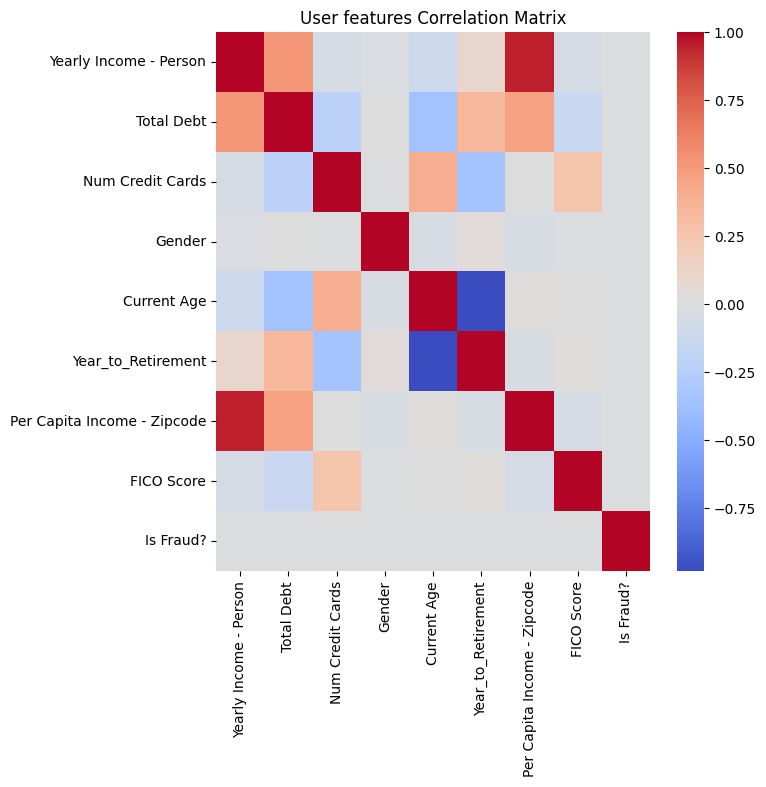
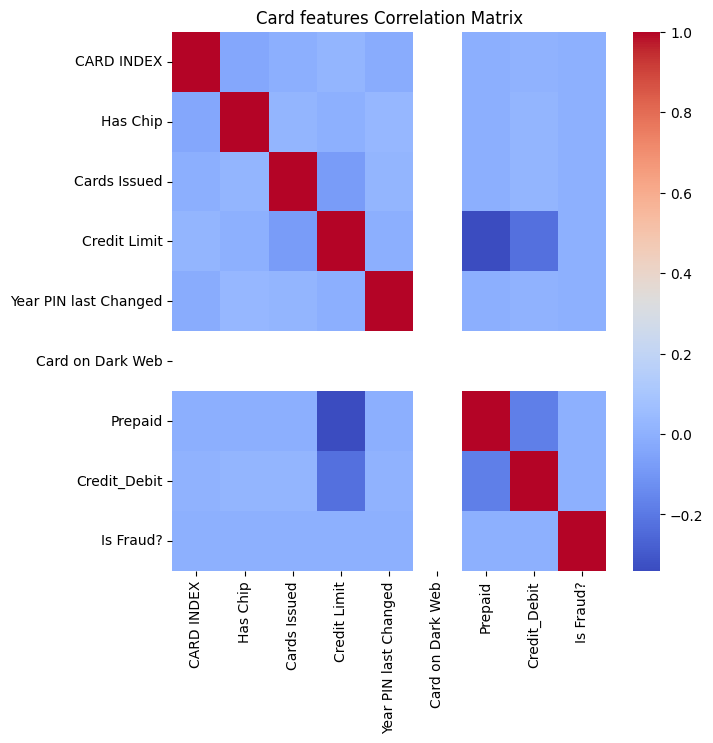
Following are the separate correlation heatmap. They show that there’s no obviously linear correlation in our features to fact that it’s fraud or not, which implies that Linear modeling might not work in our case.
From those correlation matrix, we can also derive that: 1) Higher the salary of people you live around with, higher the income you tend to have. 2) Higher the income, higher the debt/credit limit people tend to afford. For those columns that has only one unique value: such as Card on Dark Web, Bad Card Number, and Bad Expiration, I decided to drop those columns since it’s not helping us making decision.
![]()
<br > <br >
Feature Engineering
Given the size and complexity of this dataset, feature engineering is crucial to reduce noise and enhance data quality. Here, I apply two methods to counter some of the interfering factors of our dataset: Robust Scaling, and SMOTE+ENN resampling
Compared to standard scaler, robust scaler provides a wider range of values, and therefore with the presence of outliers, it tends to not produce distorted interpretation of original distribution.
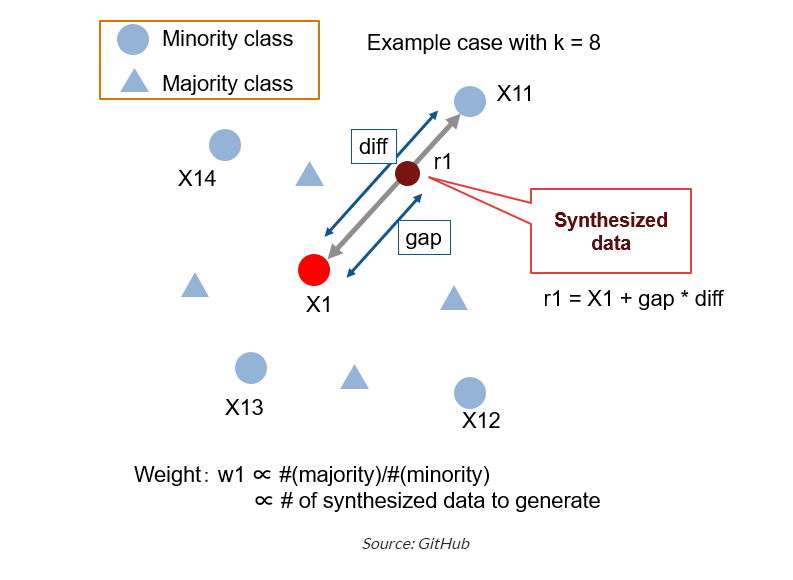
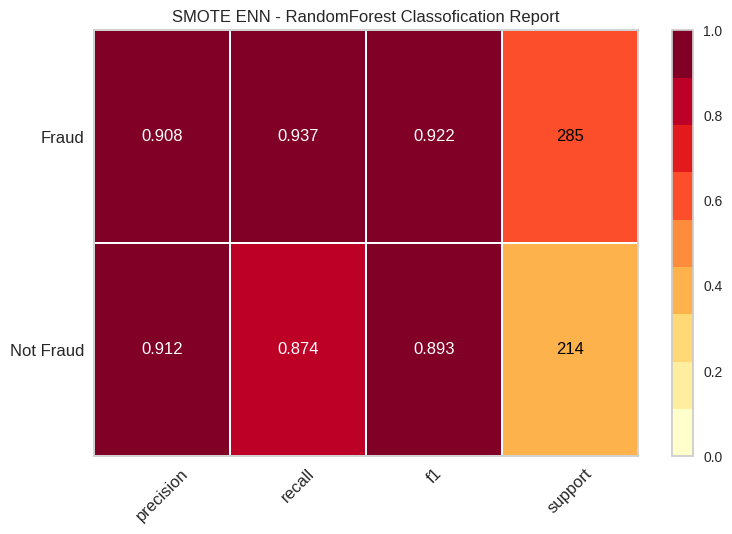
While for fraud detection projects, bootstrap oversampling might be a popular choice of handling imbalanced data, SMOTE + ENN method breaks the limit of simply copying minority of data and use synthetic data augmentation, which eventually provides model with more information to learn.
<br > <br >
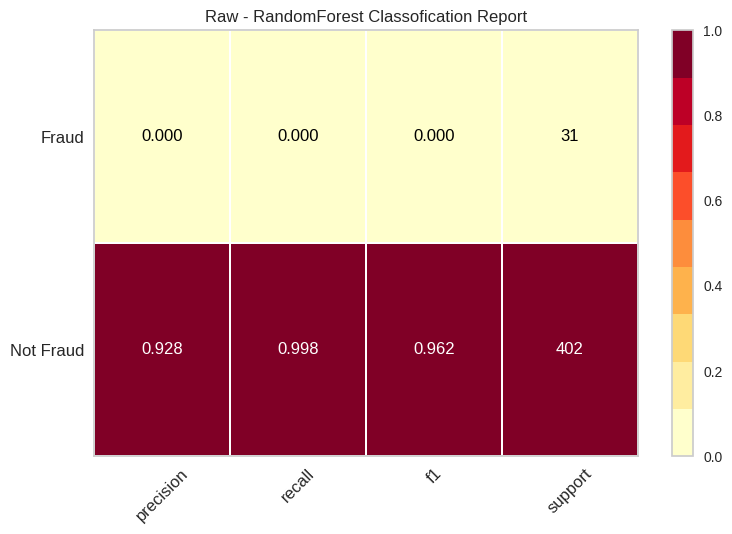
Model Building and Evaluation - all data
I use machine learning models like Random Forest, XGBoost, and Neural Network for fraud detection.
Details of model building, parameter tuning, and evaluation metrics are discussed.
# Initialize RandomForest
model = RandomForestClassifier(random_state=42)
model.fit(trainX, trainY)

# Predictions and Evaluation
predictions = model.predict(validateX)
print(classification_report(validateY, predictions))
# Initialize Linear SVM
svm_model = LinearSVC(random_state=42)
svm_model.fit(trainX, trainY)

# Predictions and Evaluation
predictions = svm_model.predict(validateX)
print(classification_report(validateY, predictions))
# Initialize XGBoost
xgb_model = XGBClassifier(n_estimators=100, learning_rate=0.1, random_state=42)
xgb_model.fit(trainX, trainY)

# Predictions and Evaluation
predictions = xgb_model.predict(validateX)
print(classification_report(validateY, predictions))
model = Sequential()
model.add(Dense(64, activation='relu', input_dim=trainX.shape[1]))
model.add(Dense(32, activation='relu'))
model.add(Dense(1, activation='sigmoid'))

model.compile(optimizer='adam', loss='binary_crossentropy', metrics=['accuracy'])
model.fit(trainX, trainY, epochs=10, batch_size=32)

loss, accuracy = model.evaluate(validateX, validateY)
print(f'Test Accuracy: {accuracy}')
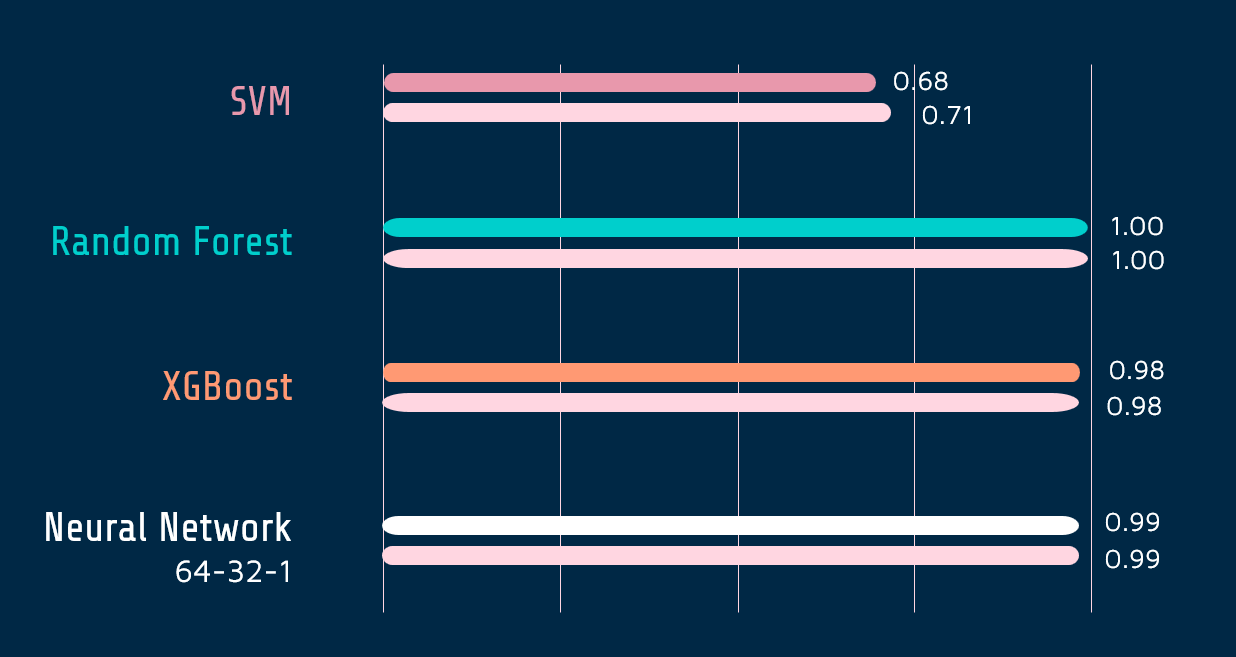
The performance of SMOTE + ENN dataset generates an unbelievable 100% accuracy, which tells there’s something wrong: Given we expand the fraud data points by almost 2000 times, our model ends up learning the generated pattern instead of our original 500 fraud transaction data.
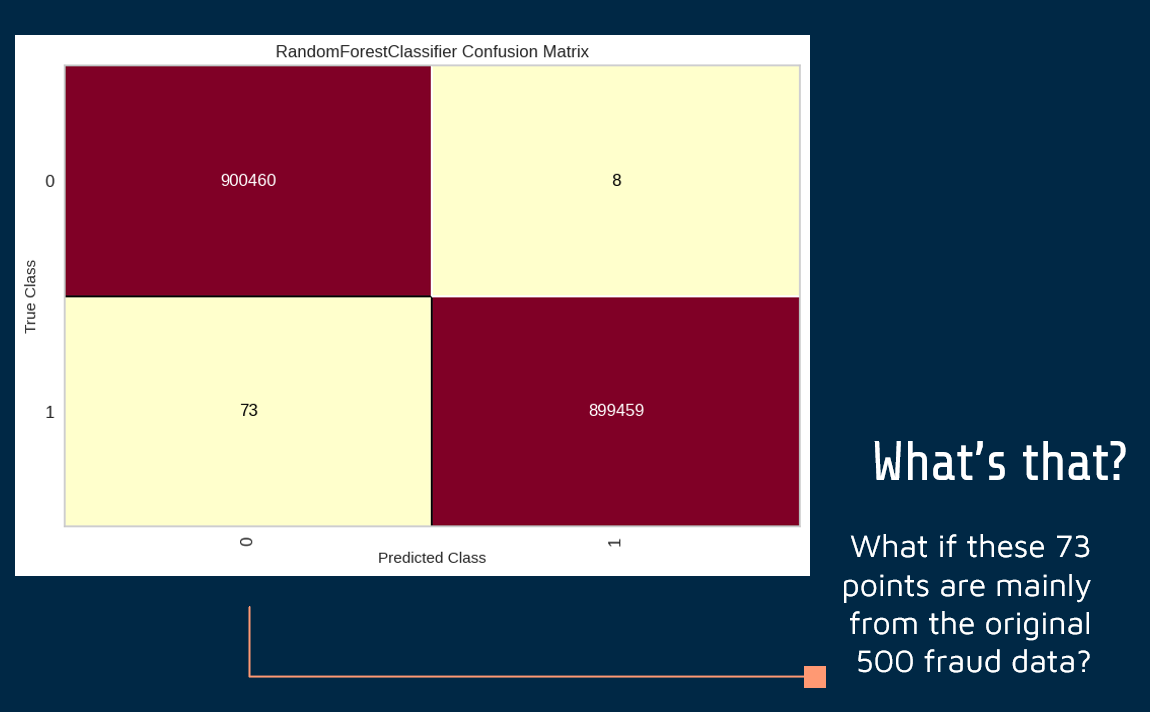 …Clearly, it’s a problem.
<br > <br >
Challenge Wrap-up
Up to this point, a challenge we’ve encountered is the scarcity of fraudulent transaction data which therefore cause an issue for our model to learn driving patterns/features for fraudulent transactions. So I decide to narrow down the scope of topic by grouping the dataframe using user, and user+card to see if I can capture the fraud better from the user who owns the card, and card which is used to make fraud transaction.
Here I groupby my data using following aggregation function and rescaling it using Robust Scaler again
df_user_card_gb = df.groupby(['User', 'Card']).agg({
                        'Amount': 'mean',
                        'Has Chip': 'max',
                        'Use Chip': 'mean',
                        'Year_to_Retirement': 'mean',
                        'Current Age': 'max',
                        'FICO Score': 'mean',
                        'Year PIN last Changed': 'max',
                        'Per Capita Income - Zipcode': 'mean',
                        'Yearly Income - Person': 'mean',
                        'Total Debt': 'mean',
                        'Credit Limit': 'mean',
                        'Prepaid': 'max',
                        'Insufficient Balance': 'mean',
                        'Cards Issued': 'max',
                        'Bad CVV': 'mean',
                        'Bad Zipcode': 'mean',
                        'Bad PIN': 'mean',
                        'Is Fraud?': 'max'
                        })
I further create a smaller batch of data that downsample matching the number of user+card entity having fraud transaction history with the ones that don’t. Here’s the visualization of comparison of them:
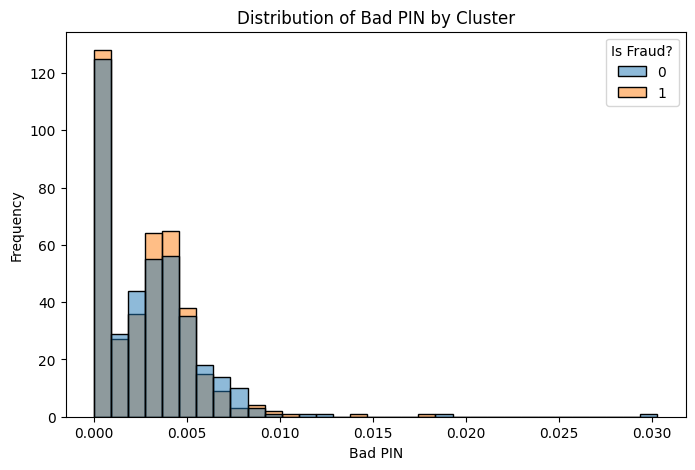
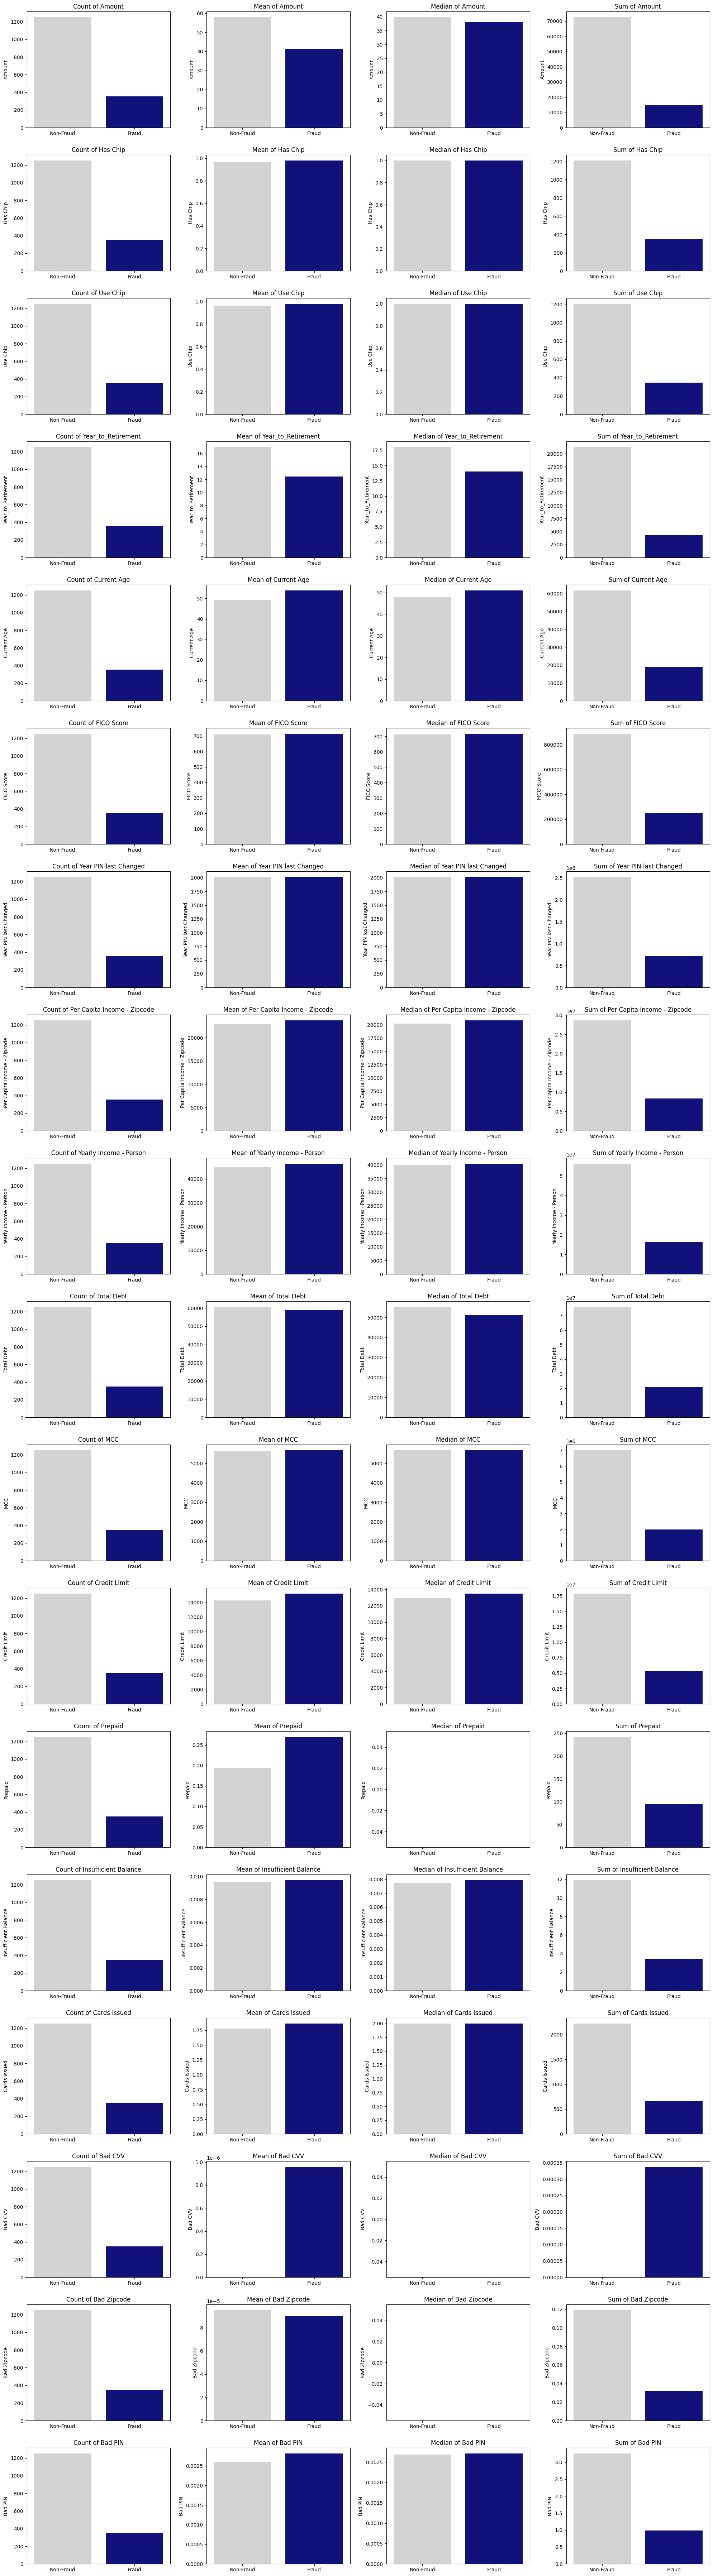
<br > <br >
Model Building and Evaluation - User+Card groupby data
Now let’s come back to see what our models can learn from these data. And we still have to evaluate the need for using SMOTE + ENN sampling because we now have a smaller dataset that’s relatively more balanced between non-fraud and fraud user+card entity(10:1).
Apparently our models keep a successful modeling on accuracy and recall compared to our falsely accurate model on 2M oversampled transaction data. But still, it shows a huge improvements on performance of models through applying SMOTE-ENN. But the question is:
Are the high accuracy and recall transferable to the original dataset?
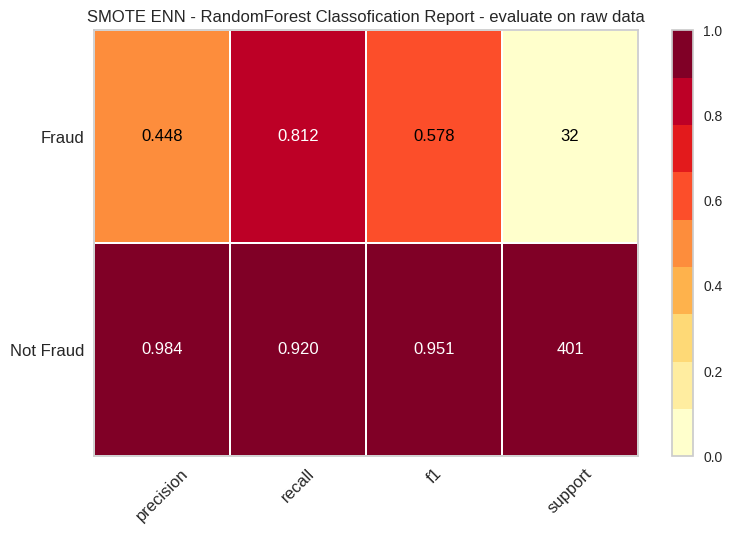 Here we notice the recall rate is still high: 81.2. While there’s still works to be done on the accuracy with unsampled fraud data. There’s still a bigger performance raise for us using SMOTE+ENN and re-evaluate on original dataset.
<br > <br >
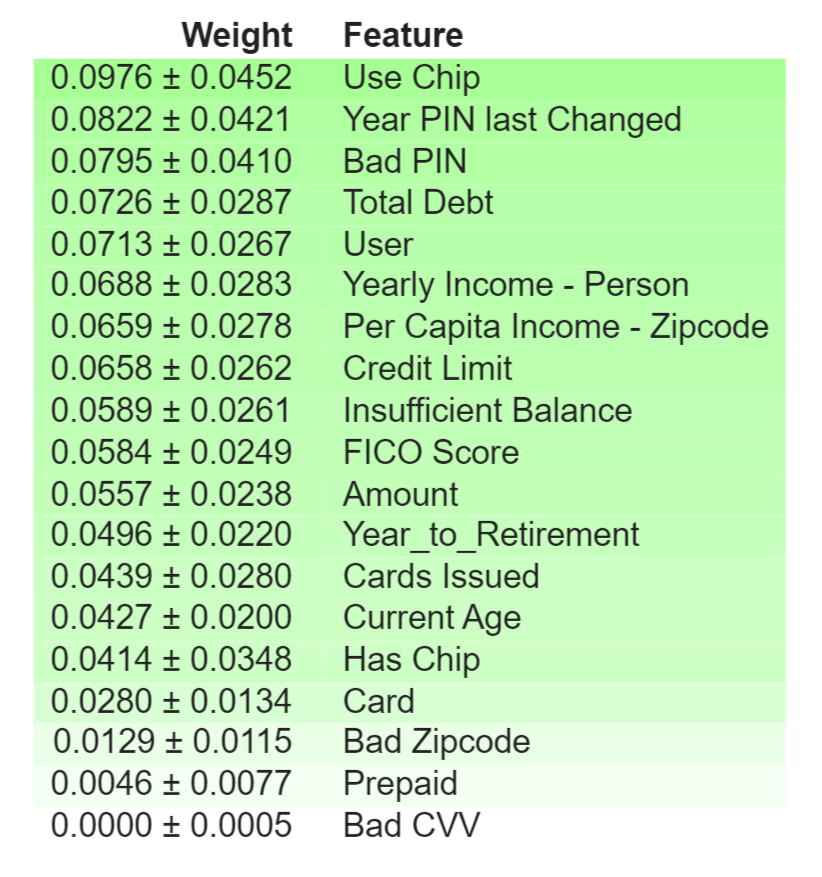
Model Interpretability with
eli5
The eli5 analysis underscores the importance of different features in the predictive model, with ‘Use Chip’ being the most influential. The presence of a chip in a card transaction emerges as a strong indicator, possibly reflecting the technology’s role in security measures. Meanwhile, ‘Year PIN Last Changed’ and ‘Bad PIN’ entries suggest that PIN management may be an area of interest in fraud detection efforts.
import eli5

eli5.show_weights(rf_model, feature_names = list(X_resample_SMOTE.columns))
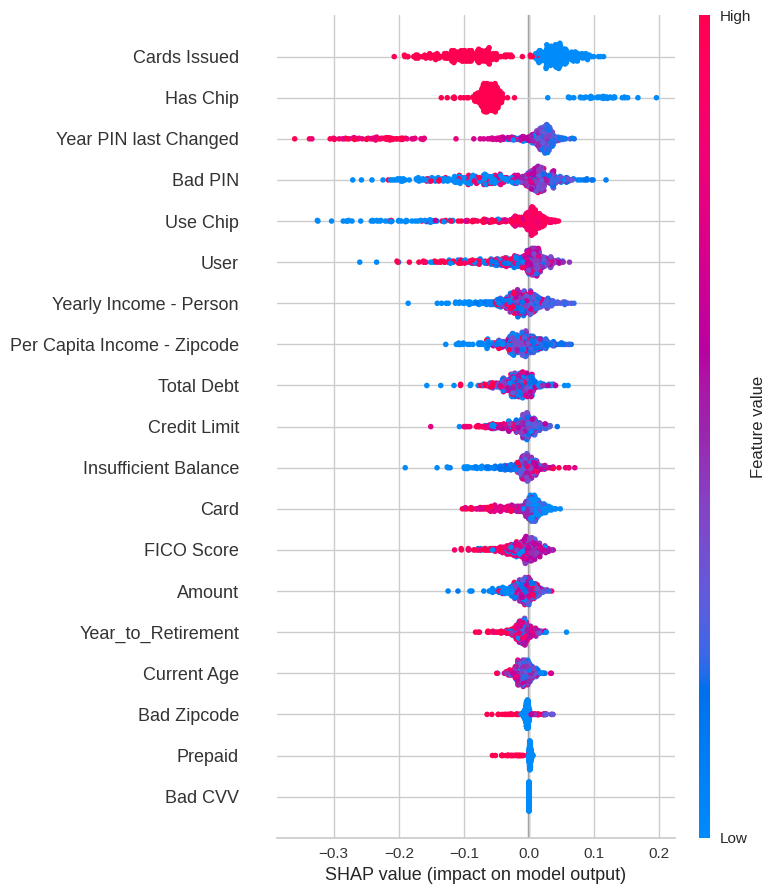
SHAP
The SHAP values chart presents a nuanced picture of feature impact, with ‘Use Chip’ and ‘Bad PIN’ showing a mixed influence on the model’s output, which could indicate varying scenarios of legitimate and fraudulent transactions. The spread of SHAP values for ‘Yearly Income - Person’ and ‘Per Capita Income - Zipcode’ underscores the complexity of income-related factors in predicting fraudulent behavior, calling for a deeper dive into socioeconomic patterns that may underpin fraud.
import shap

# Create a shap explainer
explainer = shap.TreeExplainer(rf_model)
shap_values = explainer.shap_values(validateX)

# Visualize the first prediction's explanation
shap.force_plot(explainer.expected_value[1], shap_values[1][0], validateX.iloc[0])
shap.summary_plot(shap_values, trainX, feature_names=validateX.columns)

shap.summary_plot(shap_values[1], validateX)
<br > <br >
Conclusions and Future Work
The project successfully demonstrates the use of data science in detecting fraudulent financial activities. In future work, I aim to delve into more sophisticated models and integrate real-time detection systems